
Market Trends From Around The Sound: Q4-2021
The real estate market remained as busy as ever in Q4 2021, fueled by eager buyers ready to find their dream home in a competitive market where inventory and interest rates remain incredibly low. Sellers also enjoyed unwavering interest and often sold their properties for well above asking price. Sotheby’s International Realty examines five local markets on a quarterly basis to deliver the data and insights buyers and sellers care about so they can make an informed decision and navigate the market with confidence.
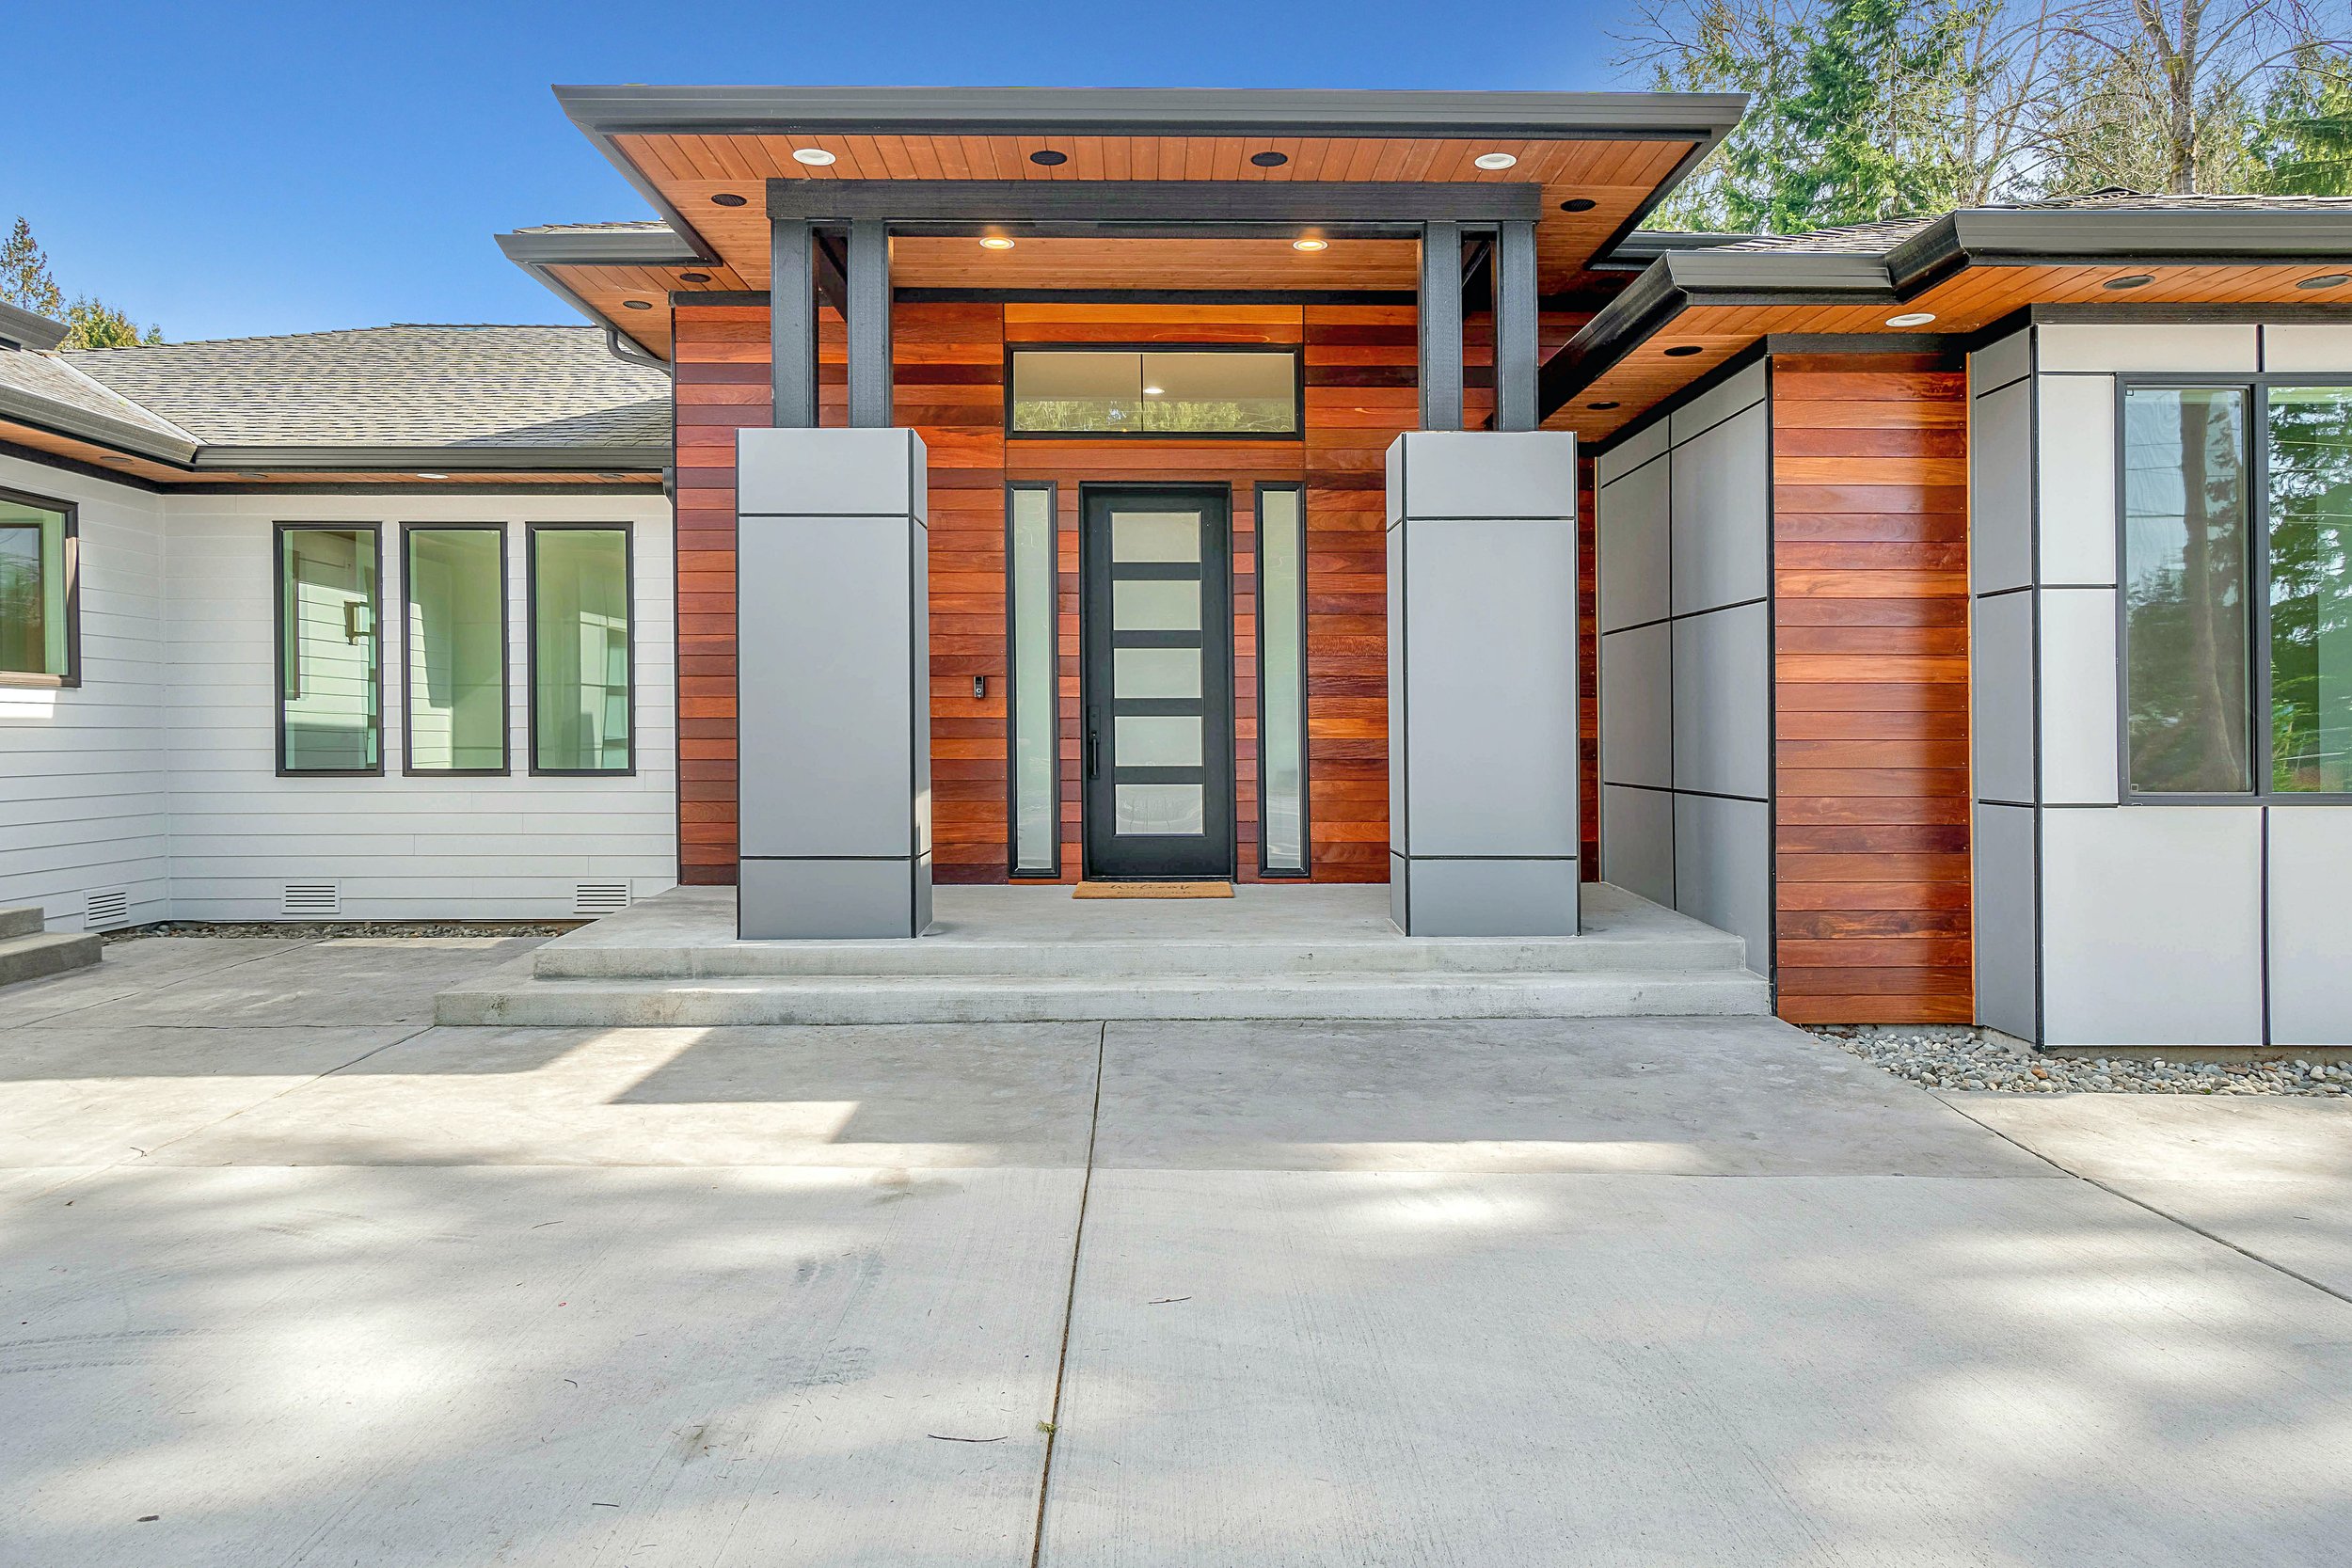
Seattle | Single-Family Homes
The price per square foot has increased in the Emerald City, up 11 percent compared to this time last year. That’s a higher increase than the year-over-year median sales price comparison: in Q3-2021 the median sales price was $908,000, up nearly six percent from $857,000. There are .7 months of inventory available in this seller’s market with 43 percent fewer homes for sale. Still, there was minimal change in the number of homes sold year over year, up 4 percent 2,184 single-family residences sold in Q3-2020 compared to 2,272 in Q3-2021.
View report>>
Eastside | Single-Family Homes
Year-over-year, the median sales price for homes on the Eastside is up nearly 30 percent. This staggering increase is only the second-highest increase in the areas examined by Realogics Sotheby’s International Realty for its quarterly reporting. Accordingly, the price per square foot is also up, just over 30 percent. Homes last on the market only nine days on average, and that’s up from Q2-2021, which hit an all-time low average of one week but is still down significantly from the then-considered swift pace of 2020. What may be the most striking is the lack of homes for sale—only half of what was available this time last year was on the market. Yet, the buyer demand was there and didn’t slow down as the number of closed homes sales was up by just under four percent.
View report>>
Mercer Island | Single-Family Homes
The average time spent on market for the 114 homes sold on Mercer Island was a scant 11 days. Not the shortest average market time, but at just a week and half, interested buyers needed to move fast and have an offer ready—and chances are that offer needed to be above asking price. The median sales price for Island homes increased by nearly 38 percent. And with half as many homes for sale as there was in Q3 of 2020, the .4 months of inventory put advantage squarely in the sellers’ court. With a square foot appreciation that matched the median sales price along with continuing buyer demand—it’s a good time to be a seller on Mercer Island.
View report>>
Bainbridge Island | Single-Family Homes
The increases on Bainbridge Island are steady and reliable. Since the third quarter of 2020, the median sales prices for a residential home on the island have ticked up year over year. Compared to this time last year the median sales price is up nearly 22 percent, from $1,049,000 to $1,278,000. The number of homes for sale on the island took a sharp drop, down 63 percent. That follows the trends from the first and second quarters, as well, when the number of homes for sale on Bainbridge peaked at 20 in Q2. Still, this seller’s market isn’t as competitive as some of the markets examined by Realogics Sotheby’s International Realty for its quarterly reporting—there’s half a month of inventory available.
View report>>
Seattle | Condominiums
Where the Seattle condo market is headed has been on many city-dwellers’ minds. It’s still solidly a seller’s market, but of the areas examined by Realogics Sotheby’s International Realty for its quarterly reporting, the condo market has had the most inventory, 1.5 months. That’s the same amount of inventory as Q2-2021 but is down significantly from the 2.6 months of inventory available during the first quarter. Still, it continued to be an advantageous time for buyers to get in the market. The median sales price ticked down by 2.5 percent this quarter, and along with it the average price per square foot, down a percent.
View report>>